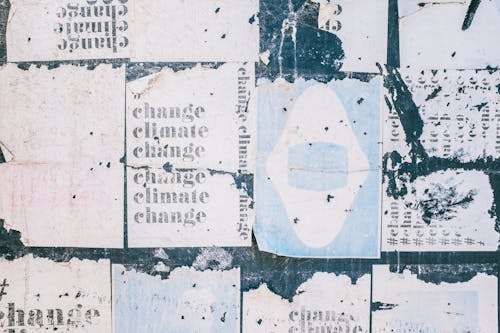
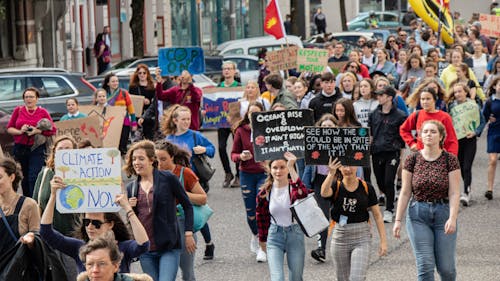
CLIMATE CHANGE THE : THE BURNING ISSUES
Friday, December 6, 2019
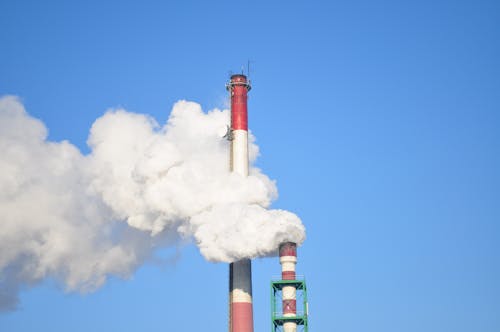
GLOBAL TEMPERAYURE RISEThe planet's average surface temperature has risen about 1.62 degrees Fahrenheit (0.9 degrees Celsius) since the late 19th century, a change driven largely by increased carbon dioxide and other human-made emissions into the atmosphere.4 Most of the warming occurred in the past 35 years, with the five warmest years on record taking place since 2010. Not only was 2016 the warmest year on record, but eight of the 12 months that make up the year — from January through September, with the exception of June — were the warmest on record for those respective month.
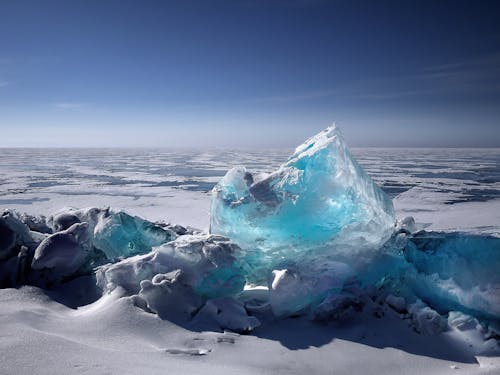
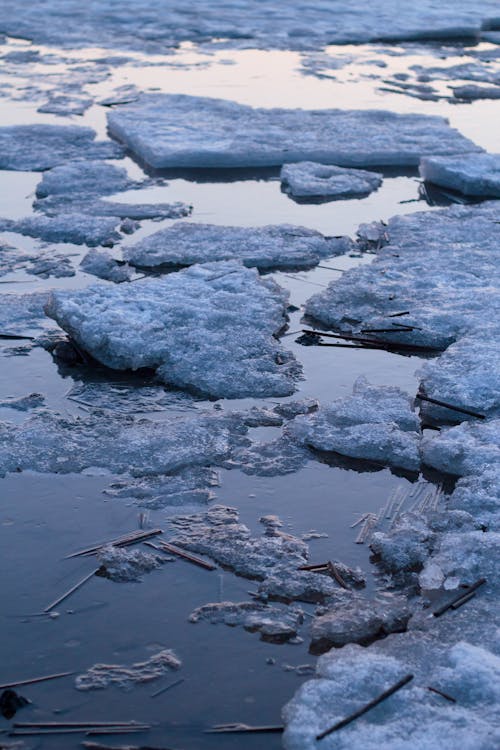
MELTING ICE
The Greenland and Antarctic ice sheets have decreased in mass. Data from NASA's Gravity Recovery and Climate Experiment show Greenland lost an average of 286 billion tons of ice per year between 1993 and 2016, while Antarctica lost about 127 billion tons of ice per year during the same time period. The rate of Antarctica ice mass loss has tripled in the last decade.7
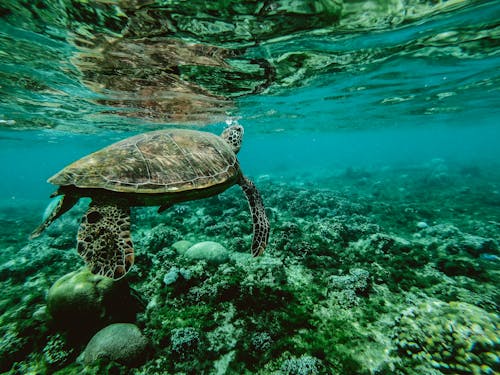
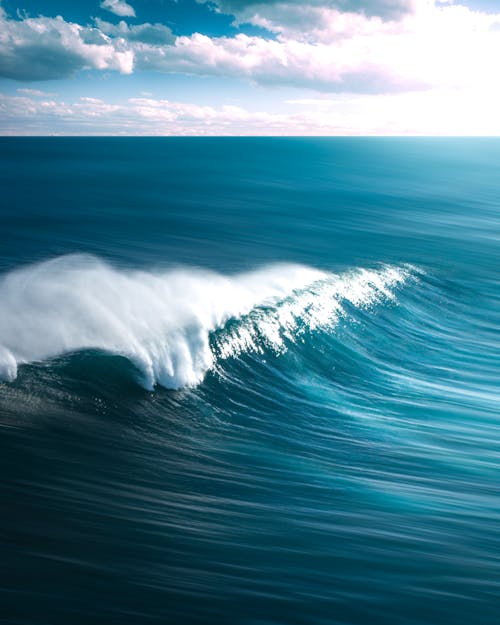
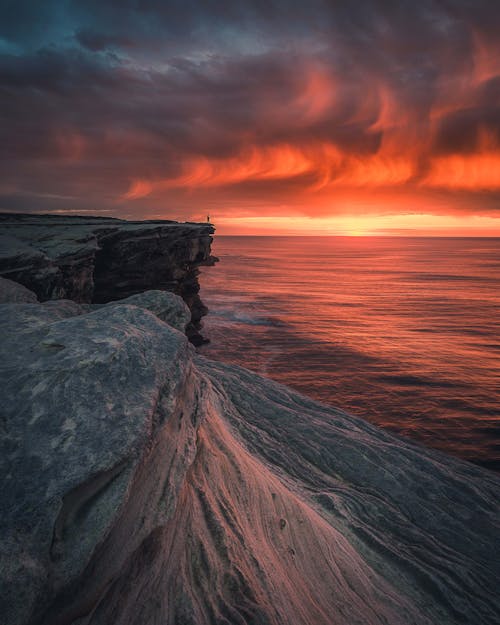
WARMING OCEAN
The oceans have absorbed much of this increased heat, with the top 700 meters (about 2,300 feet) of ocean showing warming of more than 0.4 degrees Fahrenheit since 1969

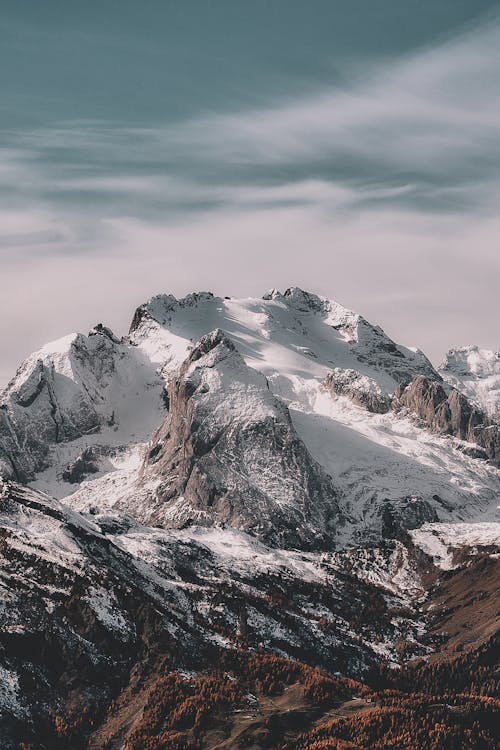
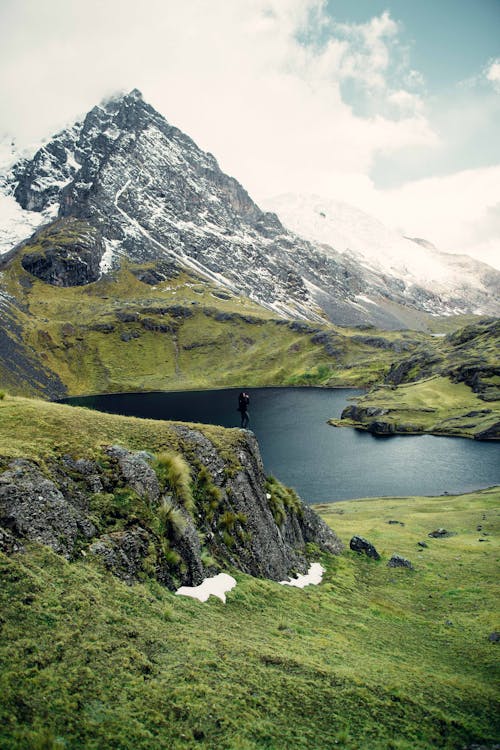
DECREASING SNOW COVER ON HIMALAYAN
Satellite observations reveal that the amount of spring snow cover in the Northern Hemisphere has decreased over the past five decades and that the snow is melting earlier.


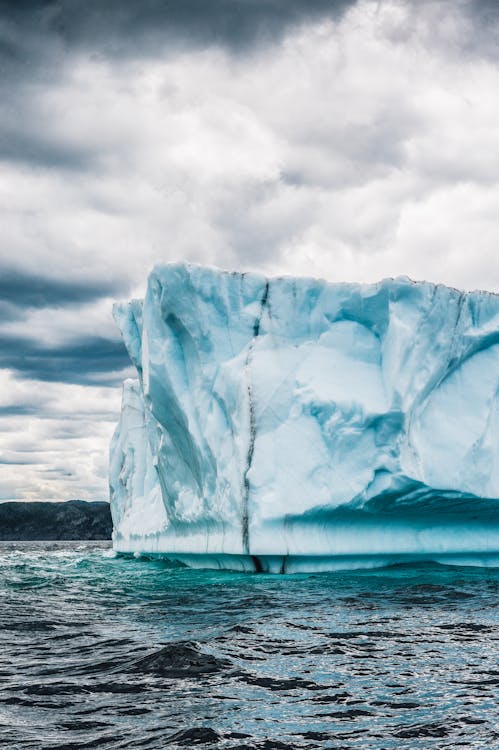
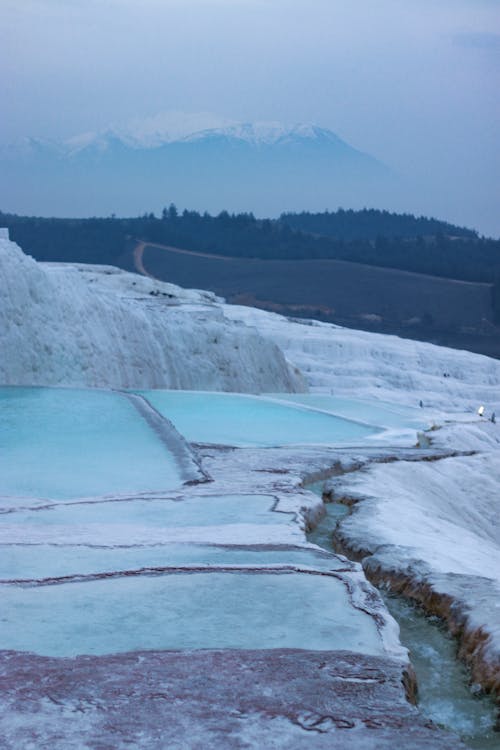
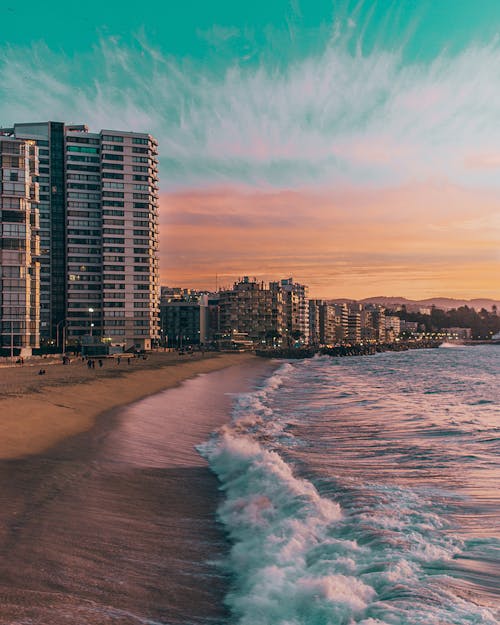
SEA LEVEL RISE
Global sea level rose about 8 inches in the last century. The rate in the last two decades, however, is nearly double that of the last century and is accelerating slightly every year

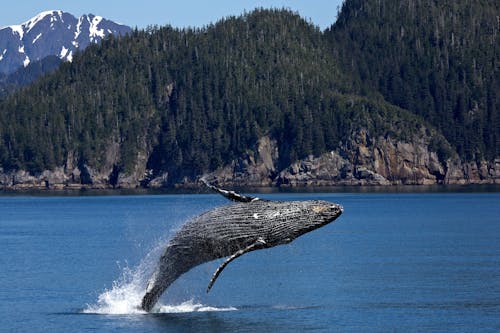
DENGEROUS EVENT
The number of record high temperature events in the United States has been increasing, while the number of record low temperature events has been decreasing, since 1950. The U.S. has also witnessed increasing numbers of intense rainfall events
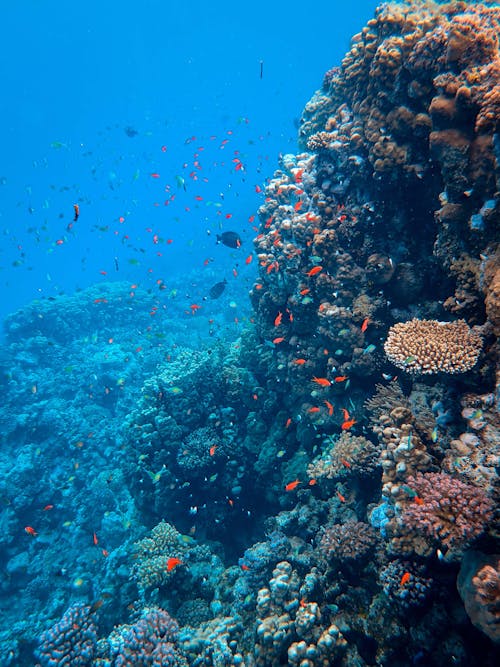
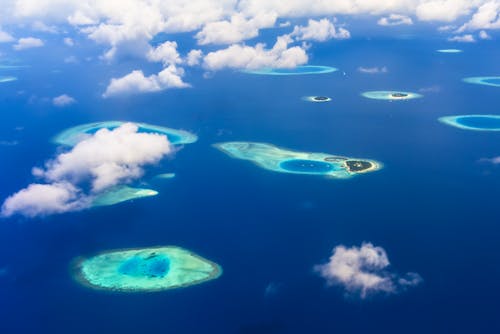
Since the beginning of the Industrial Revolution, the acidity of surface ocean waters has increased by about 30 percent.


ACDIFIED OF OCEAN
This increase is the result of humans emitting more carbon dioxide into the atmosphere and hence more being absorbed into the oceans. The amount of carbon dioxide absorbed by the upper layer of the oceans is increasing by about 2 billion tons per year